-1783304403050.jpg)
How the Singapore Land Authority is raising the bar for climate research using precise spatial data
By Rachel Teng
Data is the new oil. GovInsider speaks to one of the biggest miners of spatial data in Singapore, the Singapore Land Authority, to find out how exactly data furthers climate research.

Image: Singapore Land Authority
At the recent UNFCCC COP27 climate conference held in Sharm-el Sheikh, Egypt, Singapore’s Minister for Sustainability and the Environment Grace Fu iterated that Singapore will leave “no stones unturned” in Singapore’s climate action strategy. She announced Singapore’s updated goal of peaking emissions by 2030 and committing to a Nationally Determined Contribution of 60 million tonnes of carbon dioxide by the same year.
But how does Singapore track the success of its climate goals?
How can the island nation know with certainty that it has sequestered enough carbon to mitigate national emissions? Or that it has guarded properly against rising sea levels, or implemented enough cooling strategies to counter the urban heat island effect?
Amid rising skepticism of carbon markets being tainted by projects that have failed to deliver, government leaders and citizens alike are demanding trustworthy numbers that hold nations accountable to their climate commitments. As British data scientist Clive Humby puts it, “data is the new oil”.
One government agency is the “unsung hero” of data collection, archiving a treasure trove of spatial data in the background. This is the Singapore Land Authority (SLA).
“We have put in place appropriate infrastructure to leverage geospatial technologies, and have captured very detailed fundamental geospatial data that can support efforts to enhance the resilience of Singapore in the fight against climate change,” says Dr Victor Khoo, Director of Survey and Geometrics at SLA.
Data takes time to yield benefits, and the agency is starting to witness these returns in recent years. “These investments are critical in helping us achieve our net-zero climate outcomes as geospatial data and technologies can offer deeper insights into environmental changes,” he says.
Carbon estimation
SLA began a 3D mapping programme in 2014 to assist with urban planning activities such as underground utility mapping, flood management, and airflow analyses. A key mapping technology involved in this is remote sensing technology, LIDAR (which stands for Light Detection and Ranging).
This highly rich data, Khoo says. Through this, the sensors are able to achieve a mapping accuracy right down to the centimetre, which satellite technologies are not able to achieve. Satellite remote sensing methods can only capture points a few metres apart, leaving many gaps in the data for flood or vegetation modelling.
Today, LIDAR helping the National University of Singapore’s Centre for Nature-Based Climate Solutions (CNCS) estimate the amount of carbon stored across Singapore’s green spaces.

While scientists do possess global estimates of carbon sequestrations, the margins of error in Southeast Asia are significantly large, which may have implications on the reliability of carbon markets on this side of the globe. “If you have large uncertainties for carbon estimates in Southeast Asia, this also translates into investor and price uncertainties,” says Dr Jose Don Tungol De Alban, a researcher at CNCS.
LIDAR can also make such research more cost effective by reducing the manpower required, says Dr Manjari Jayathilake, project lead for CNCS’ collaboration with SLA. In the past, this work was entirely manual – field research would involve people on the ground taking measurements of every single tree.
CNCS is also hoping to create a model to see how much how the amount of carbon stored in trees has changed in Singapore over a five-year period, using two of SLA’s datasets from 2014 and 2019. “This could be an ongoing project if SLA intends to collect new datasets,” says Manjari.
The team is aiming to publicise its findings by the end of 2023. Moving forward, CNCS may also look to estimate carbon in the garden city’s parks, gardens, and roadside trees as an extension of this study.
Guarding against sea-level rise
In September 2022, researchers at the Nanyang Technological University’s (NTU) Earth Observatory of Singapore found that Southeast Asia’s coastal cities are sinking the fastest globally, leaving the lives and livelihoods of its people vulnerable to the impacts of extreme rainfall and flooding.
Data from the study was conducted using Interferometric Synthetic Aperture Radar (InSAR) – the current technique NTU uses to map ground deformation over Singapore and other cities in the region. A four- year memorandum of understanding (MOU) signed between NTU and SLA in June 2022 to use SLA’s Global Navigation Satellite System (GNSS) data is also expected to contribute to more accurate ways to measure land height and sea level changes around Singapore in future studies.
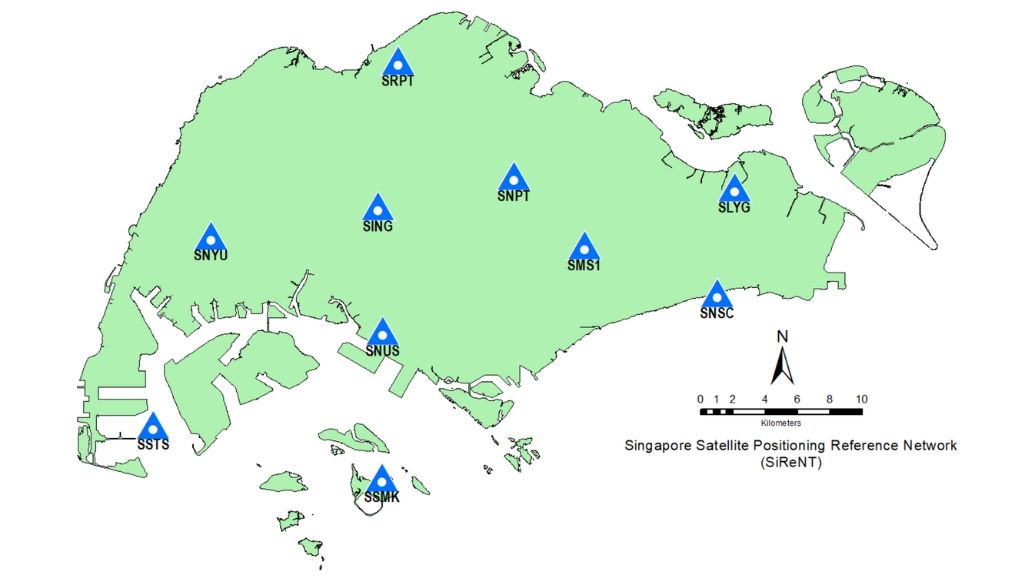
GNSS refers to a system of satellites that transmit precise positional and timing data. Tapping on the GNSS, SLA has developed a ground-based infrastructure known as the Singapore Satellite Positioning Reference Network (SiReNT), which has applications in various sectors including sea-level or vertical land movement monitoring, or even digital geofencing in which alerts could be triggered when machines move into restricted areas for example, says Khoo.
One rising type of GNSS is satellite reflectometry, a relatively new technique adopted in Singapore. Satellite reflectometry measures the amount of microwaves that are reflected off of a surface to help researchers understand the pattern of movement of water surfaces.
This then allows researchers to determine water levels in deep oceans and tide gauges near the coast, which will allow for more accurate analyses in sea level changes, Khoo explains.